
Assignment #2
Assignment 2: High Field of View
Assignment Description
For this assignment, we are to create a High Depth of Field Image from a sequence of images with varying focus. From these images, we should create: one image where all objects are in focus; an image that shows from which image was a particular focused pixel was taken from. This image is known as a depth map. We are also to create an 2 images with a special effect applied to it. The first special effect is where we can vary the depth of field of an image, thus being able to change where the image appears to be focused. The second special effect is to select a group of columns, left to right, and select the depth to show from the first to the last image in the sequence. This will create an image where plane of focus shifts from left to right.
*All images are shown at a lower resolution. Please click on them in order to see them at full resolution. *
Images
DATASET
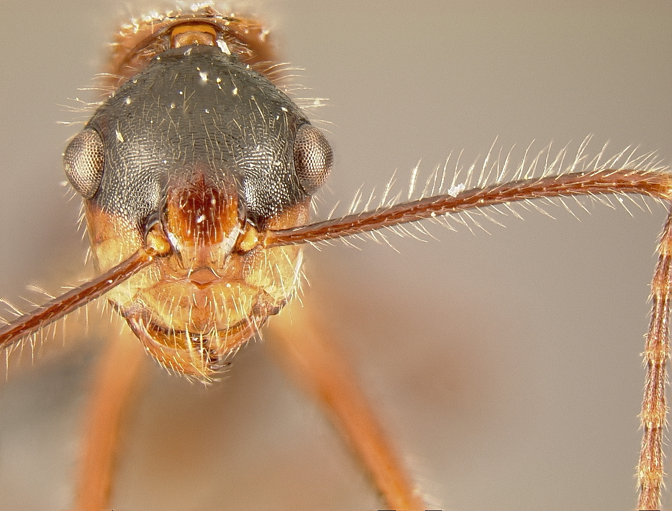
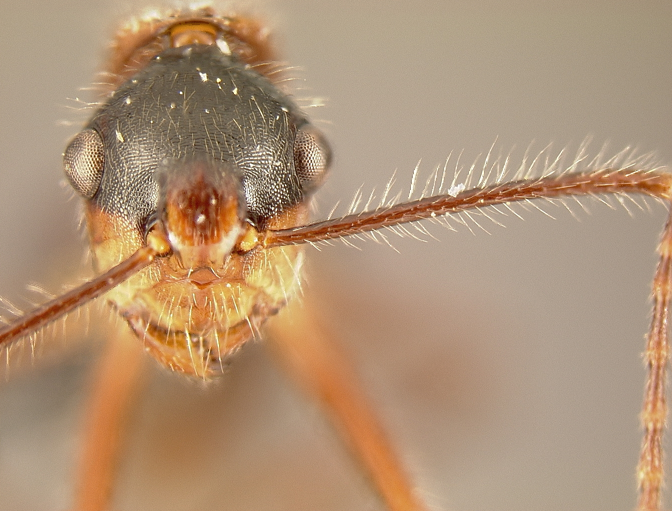
Our first set of images were taken provided in class. The following are some select images from the dataset.


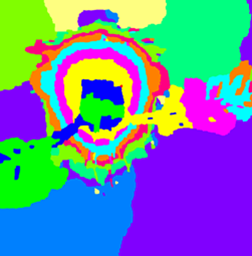
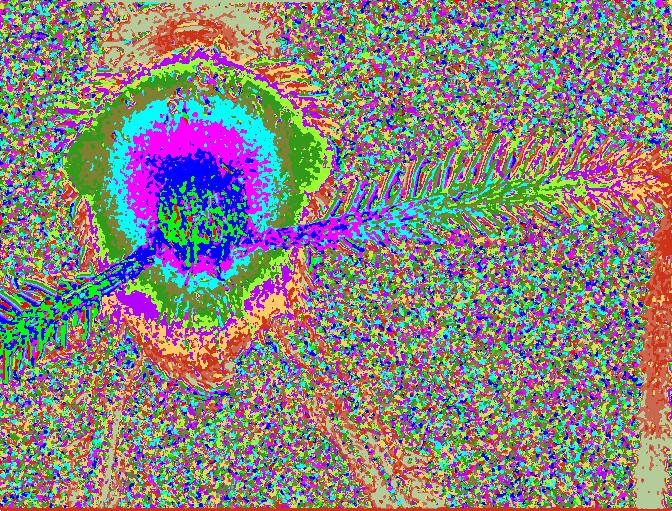
Also provided by the professor was the following generated HDR image from the dataset, along with its depth map.
This is what we normally get by averaging the images together

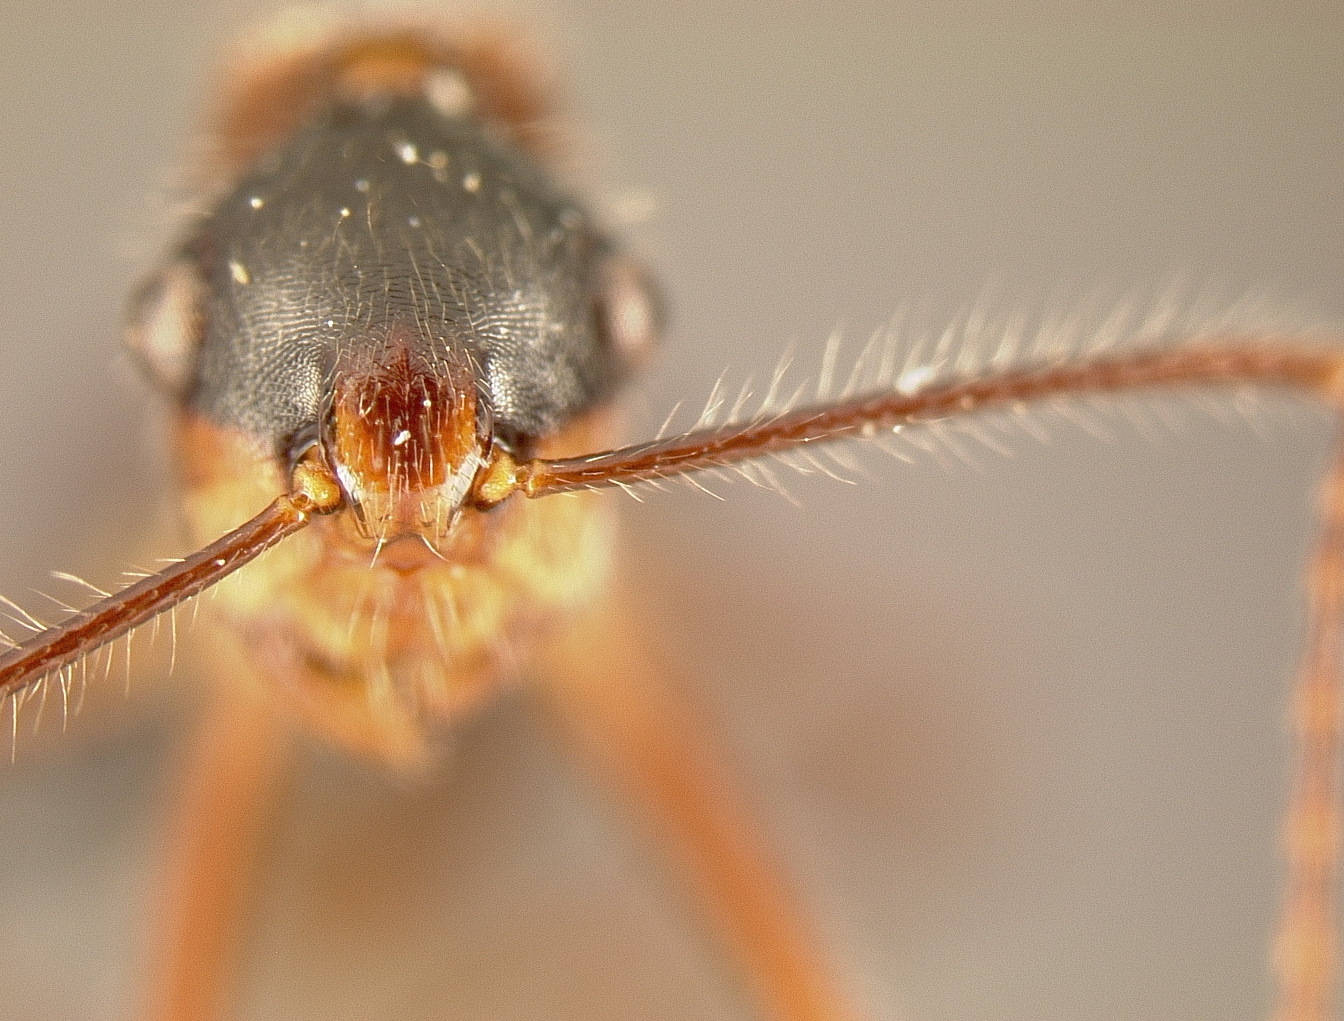
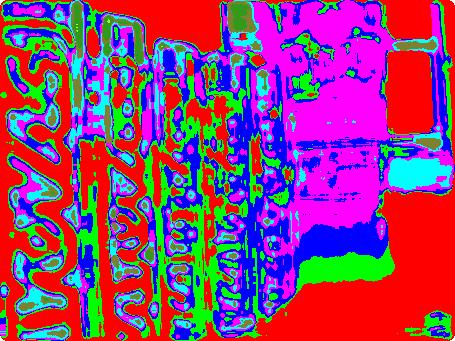
Output #1: The following image was generated on my first attempt at implementing the algorithm. To its right, you can see its depth map. Notice how the depth map for this image is noisier than the previous depth map. While we were told that this was to be expected, I believed that my depth map should not be as noisy, and therefore there had to be something wrong. One of the solutions I thought of was to apply a median filter to the depth map, and then generate the final HDR image.
Note: The following images were reduced by 50% in size, so as to be able to have a lower resolution image to work with while at the same time detailed enough to distinguish if all of its parts are in focus.

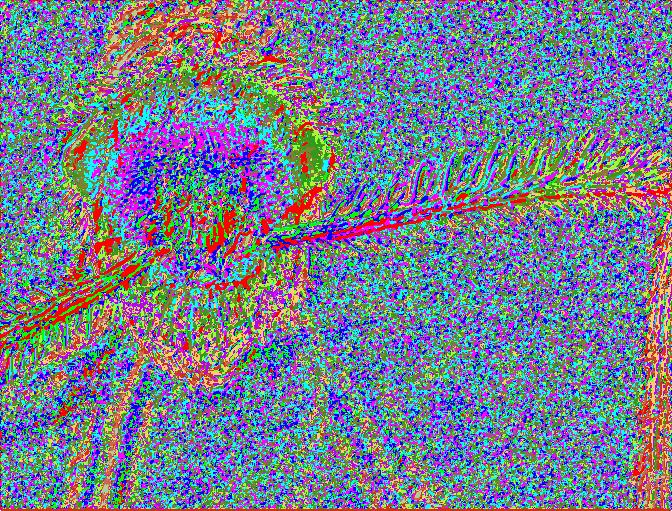
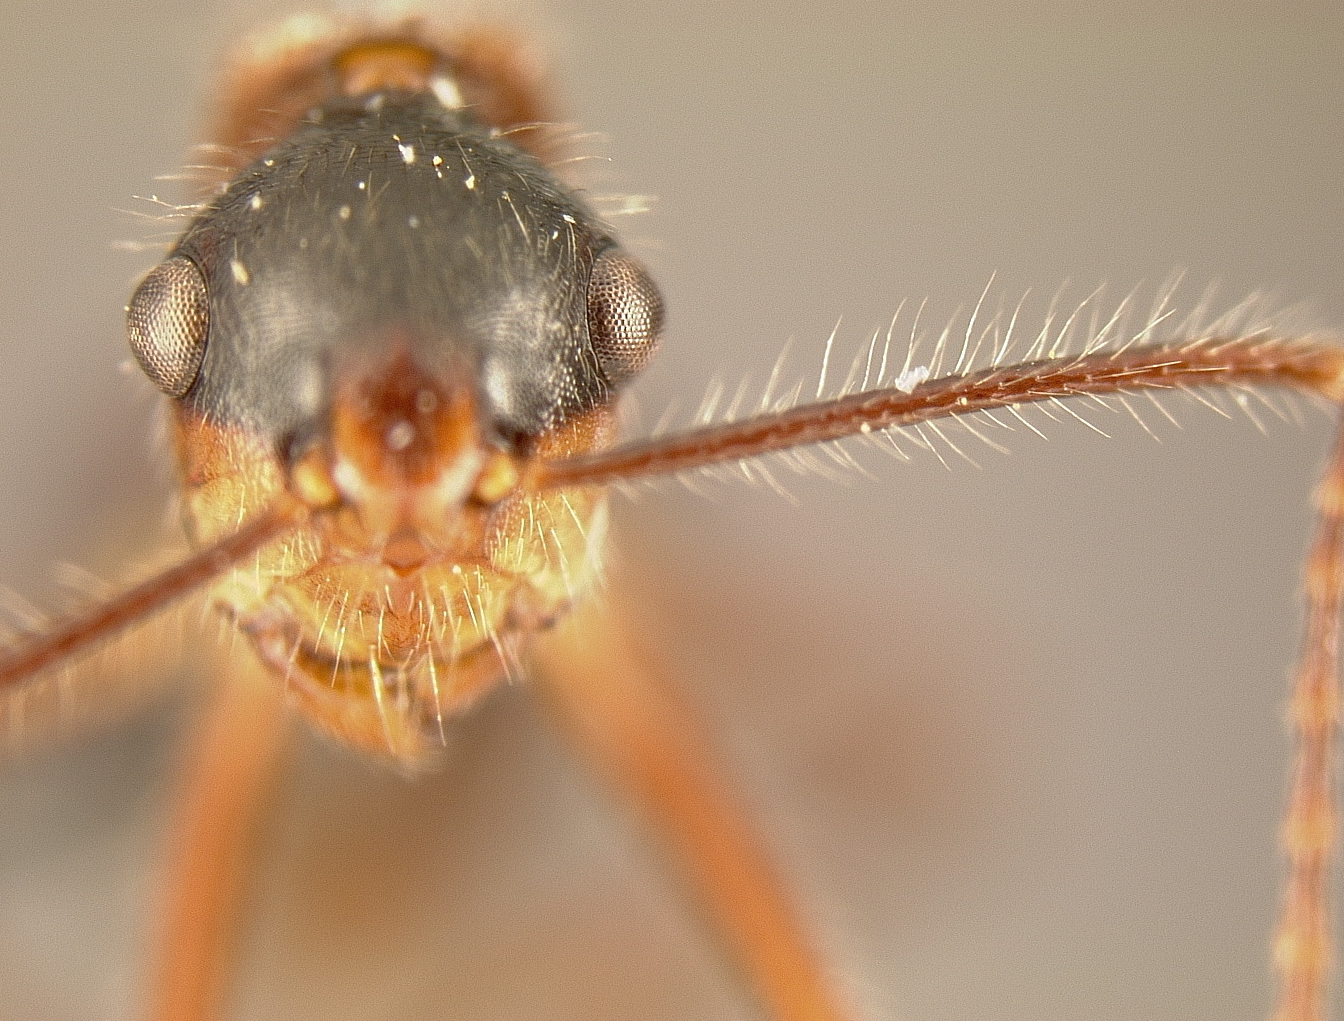
Output#2: After applying a median filter, I saw better results, which are clearly visible if you compare the gray area of both images. Yet still no crisp HSR image, at least nowhere close to the final image given by the professor. I noticed immediately that there had to be something wrong within my source code. And there was. When the source code was calculating the variance, it was only scanning the first pixel it came across, instead of a 3×3 area of the pixel we wanted to evaluate. Output#3 will show these improvements.
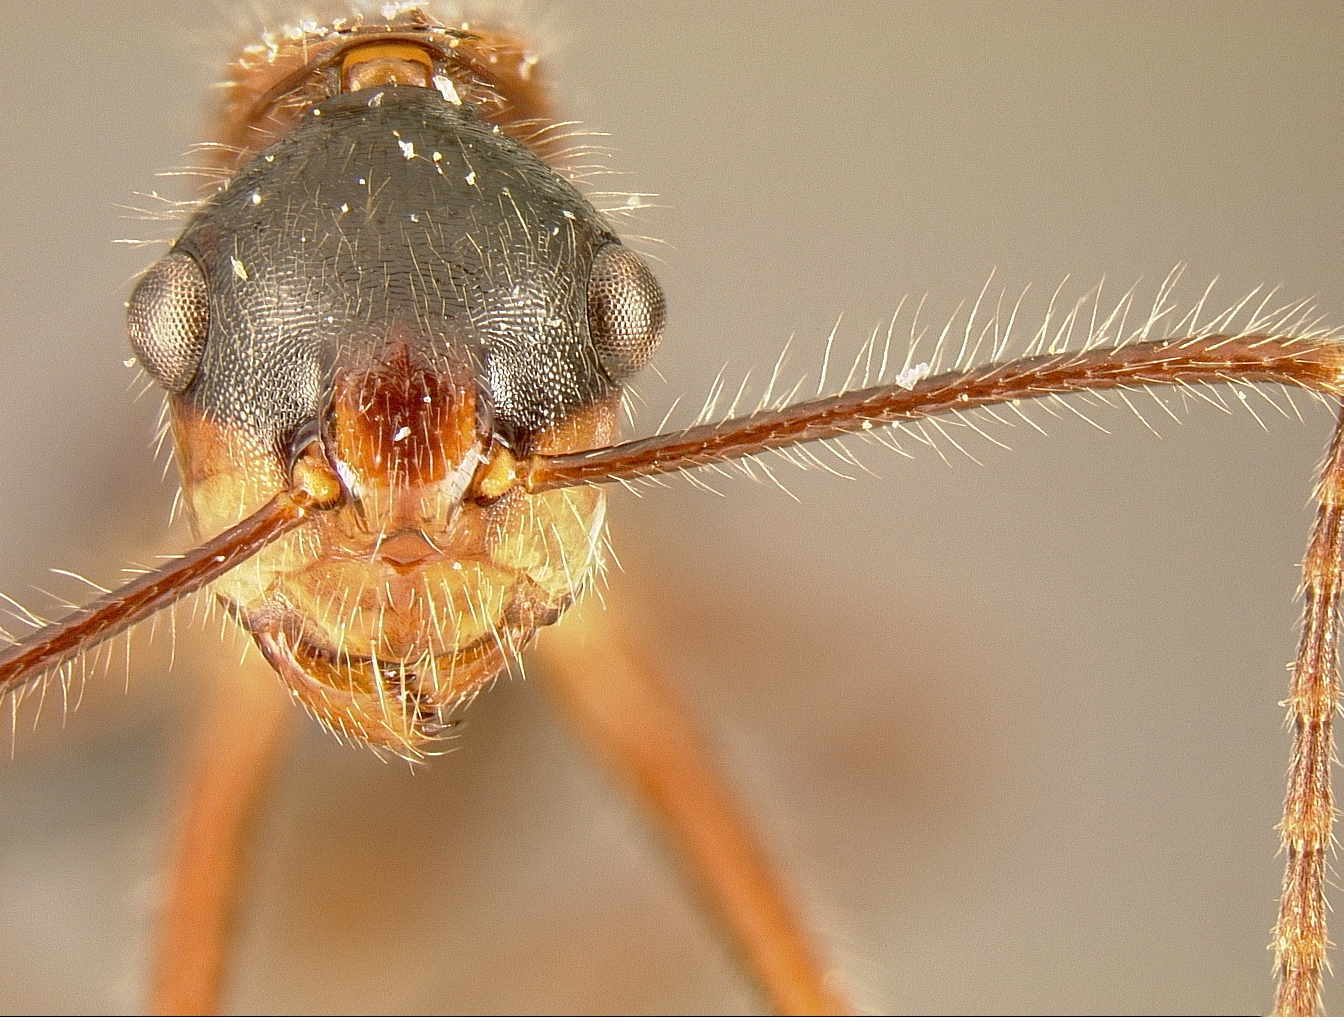
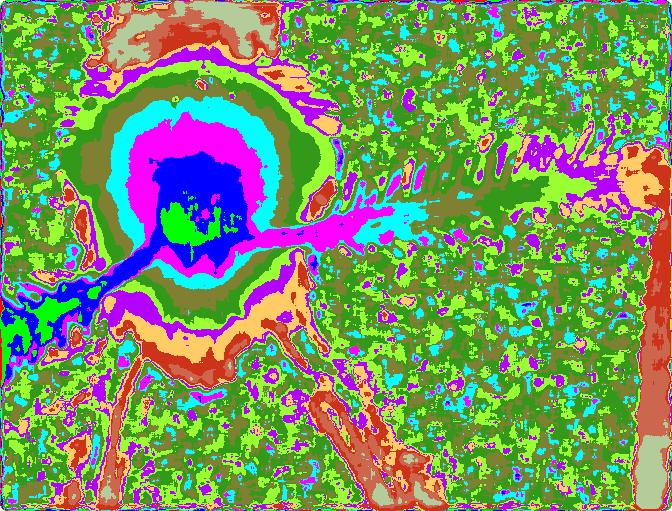
Output#3: As you can see, this output is very much close to the final HDR output given to us by the professor. The only difference is that the antennae have a slight halo around the edges. However, I believe that this is due to the background noise that the image is generating. (Update 10/17/05: Yes, this is due not because of the noise, but because this is exactly how the variance would be illustrated on a pixel by pixel basis. If you apply a median filter of size [7 7] or greater, the images will be sharper and the depth map will be closer to what the professor provided)
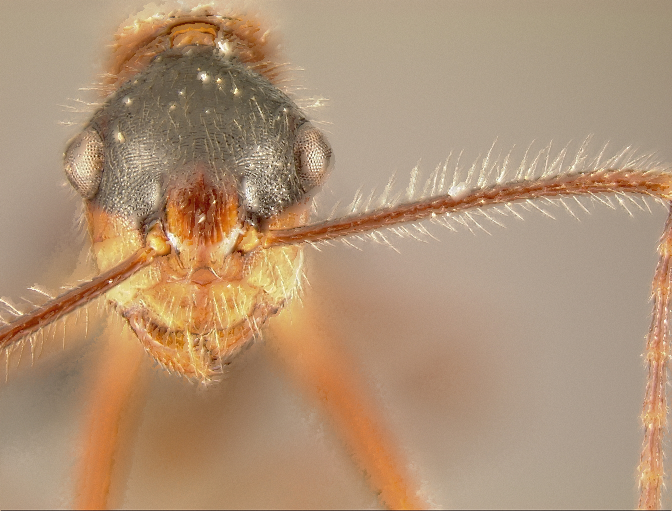
Output #4: This output image of a completely focused image was retaken after discovering that increasing the range of the median filter creates a more uniform depth map, thus eliminating the “halos” that formed around the antennae of the bug.
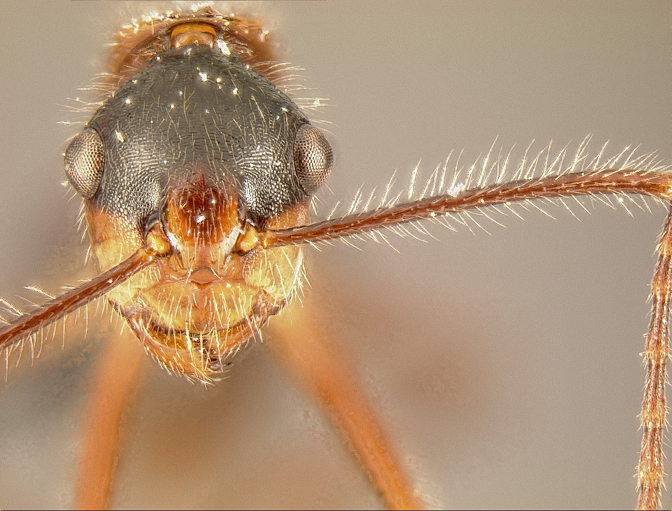
Special Effect #1:
This image was created by specifying the range from which level should the image be focused. For example, if we were to specify that the depth of field of an image is between z=3 and z=10 (where z is the number of the image in a sequence (which really stands for in where is the image in focus) ). Therefore, our algorithm states that if (z >3 && z<=10), then we should preserve the z value and keep the image in focus, otherwise we should either increase or decrease the x value in order to get a pixel that’s not in focus.
Special Effect #2:
This image was generated by generating from each group of columns, left to right, choosing the group of columns that corresponds to a successive image from 1 to n. This created an image where plane of focus shifts from left to right. In this case, I’ve chosen the width of each column to be the floor value of the width of the image divided by the number of images. If z == n (where n is from 1 to the final number of images), we will keep this focused pixel. Otherwise, if z >n, we take the z-1 pixel. Else if z < n we take z + 1 pixel (where z determines the image where the pixel is in most focus).

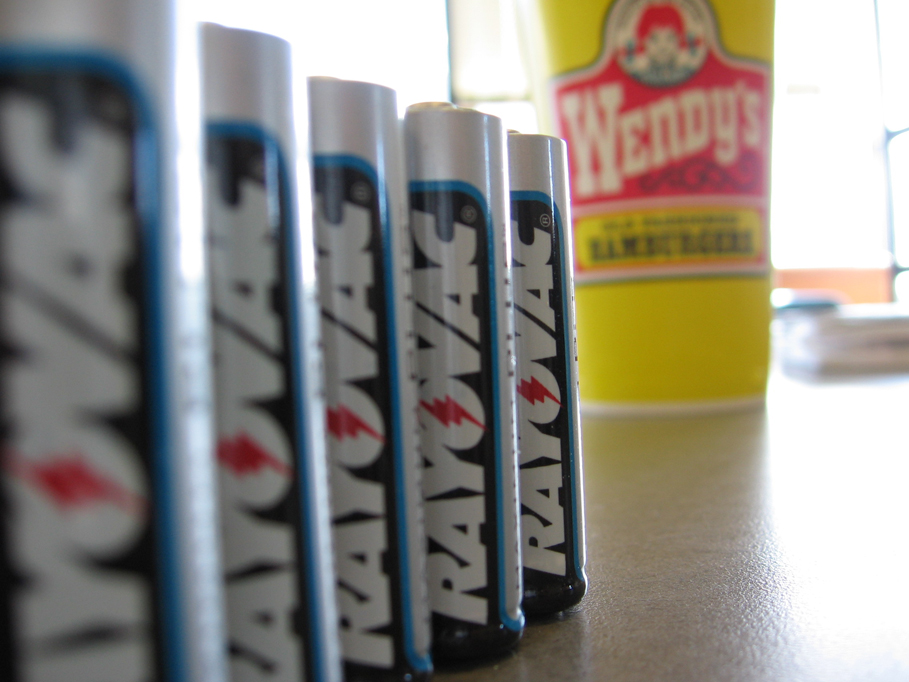
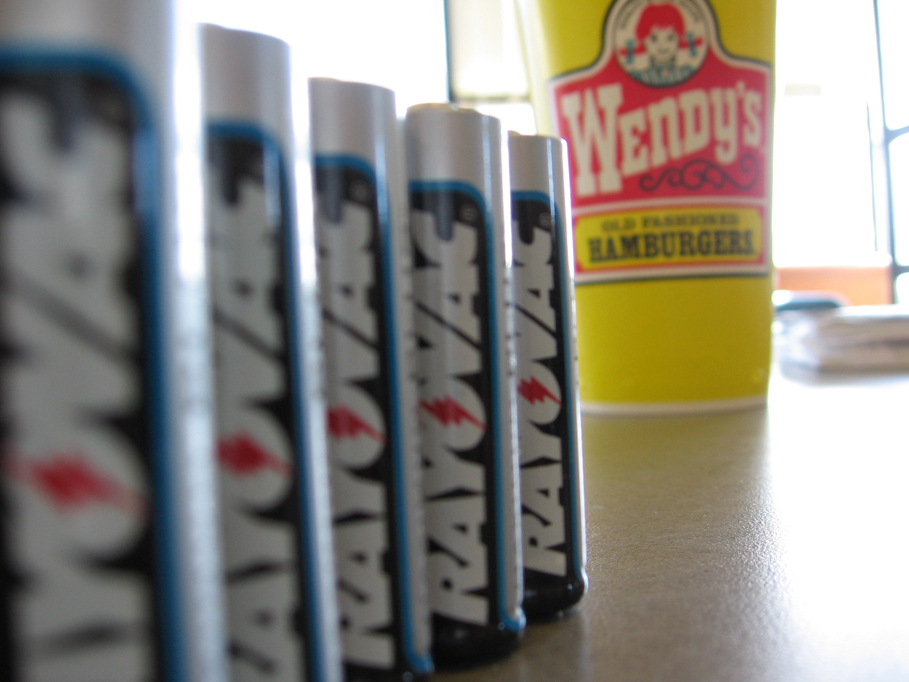
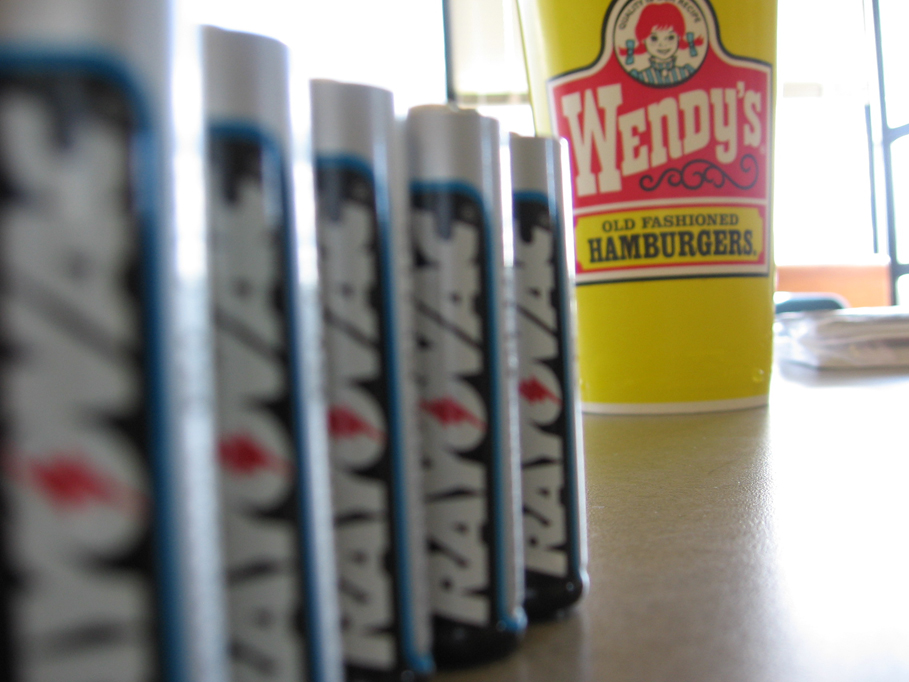
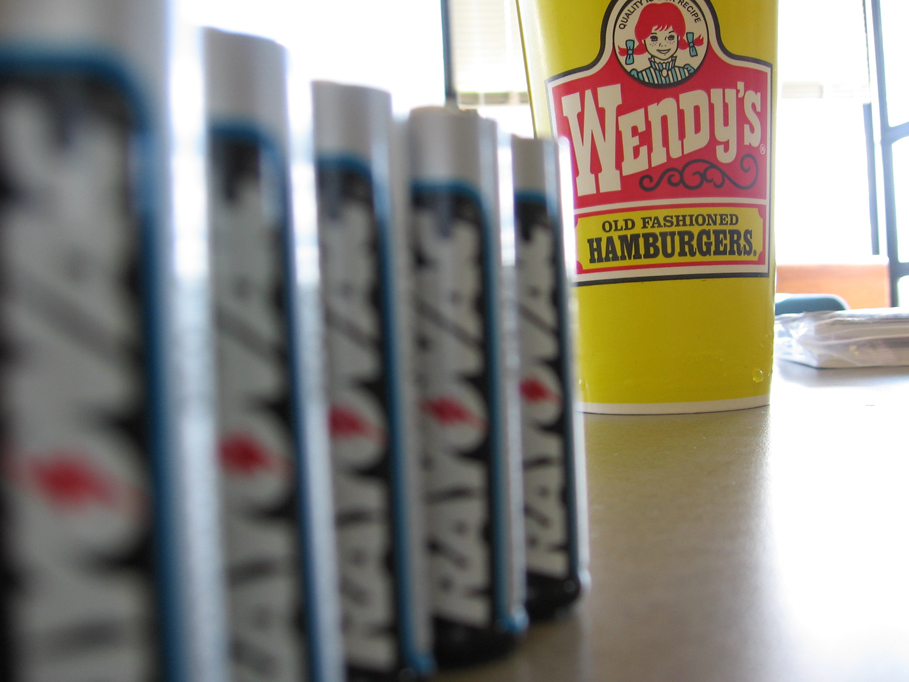
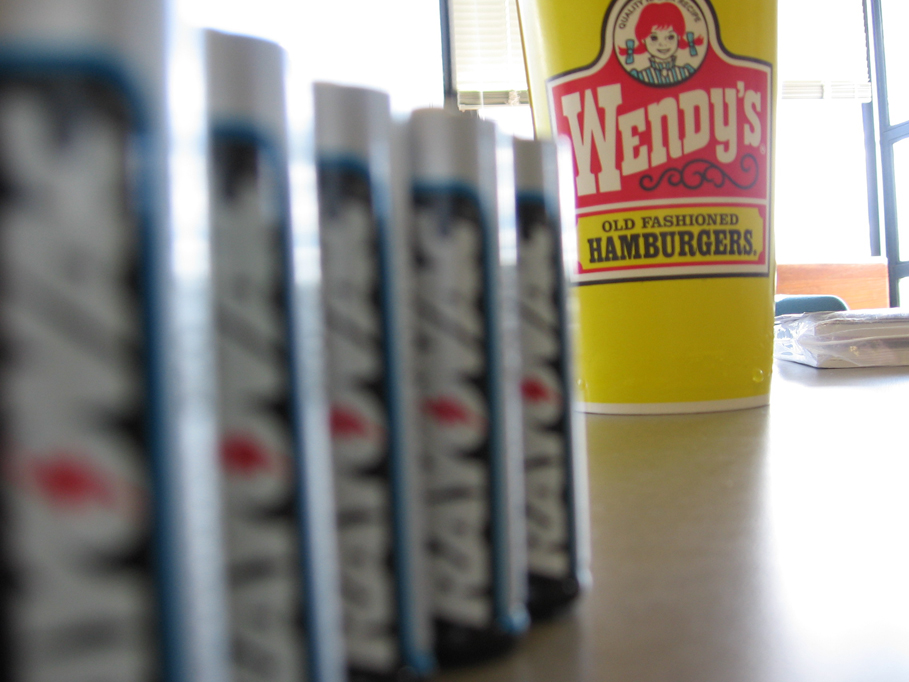
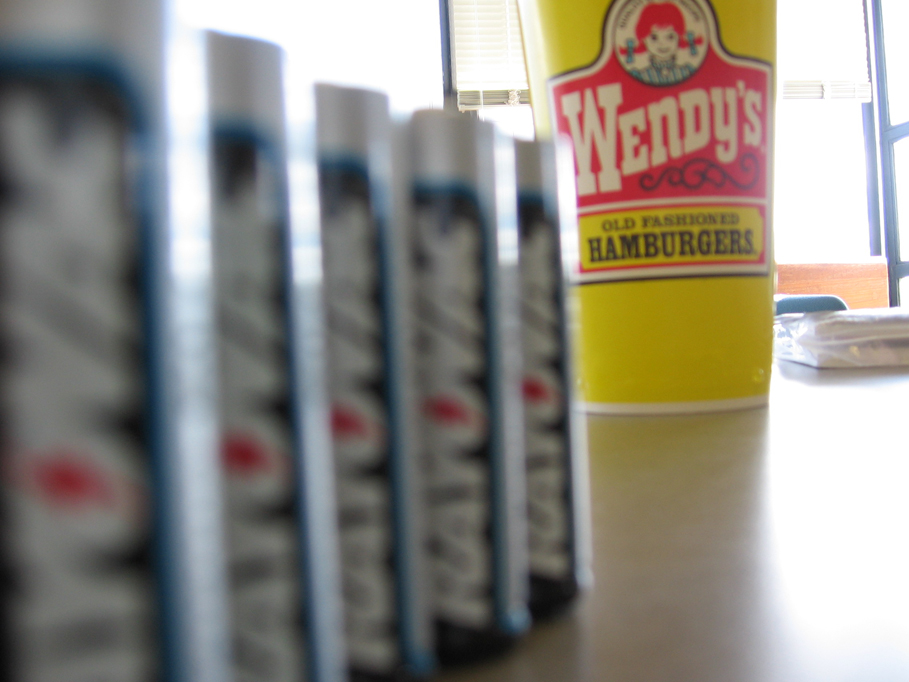
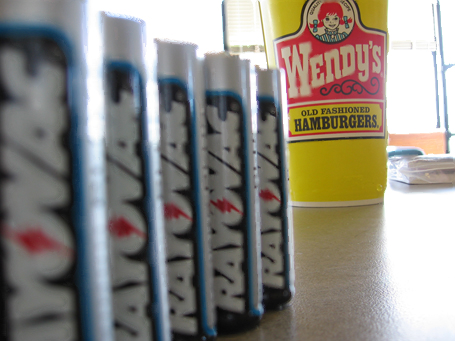
Images taken:
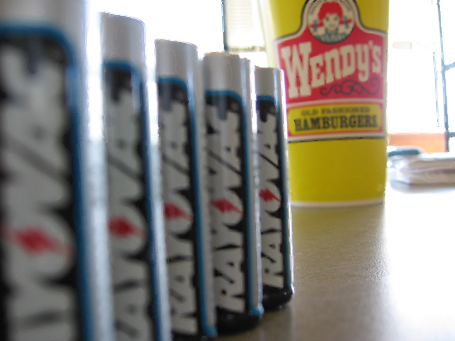
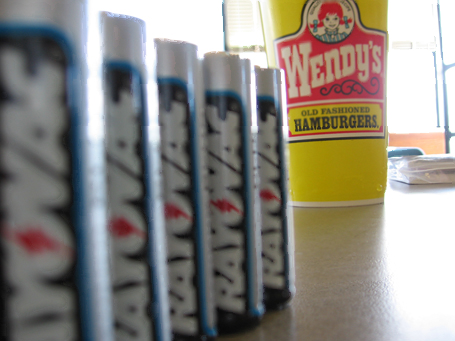
The images I’ve taken are of 5 Rayovac batteries, aligned diagonally away from the camera. Farther from the camera, there is a large Wendy’s (©Wendy’s) soda cup. Farther still is a sofa and a window. The image is overexposed, with its main light source coming from the sunlight through the windows. There were 6 succesive photographs with varying focus taken. Note that the varying focus was designed to focus ultimately on both the soda cup and the sofa, NOT on the batteries themselves.
*Note: Currently, the images uploaded are of a low resolution. As the algorithm is improved, the high-resolution images will be generated and uploaded. *
Original Images:

Average of Images
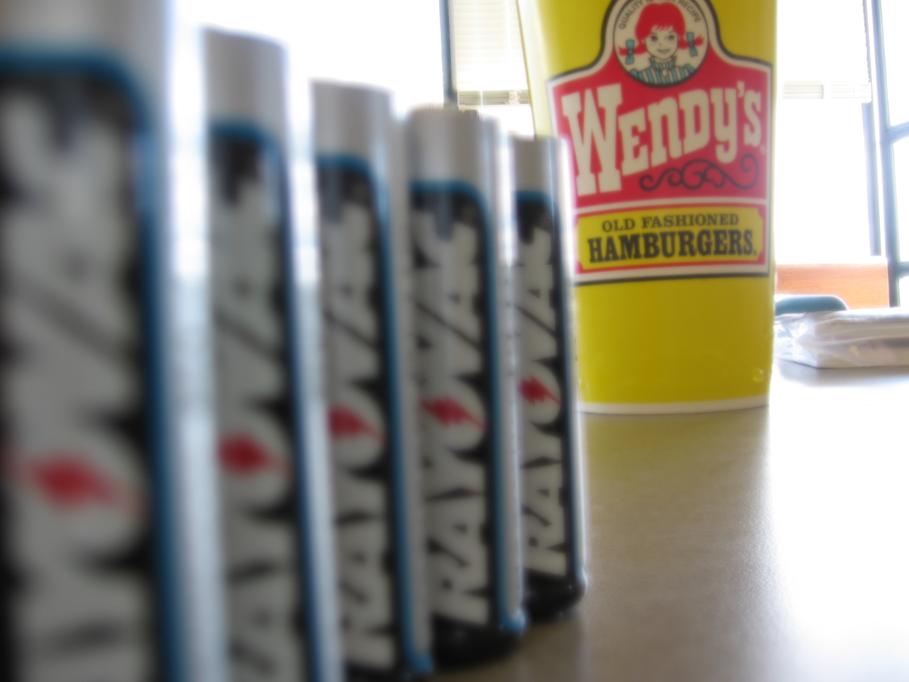
Image where all focused elements are in focus:
Special Effect #1: Range of focus is between (z >1 and z <= 3)
Special Effect #2
Links
.zip files that has all the Matlab Code, as well as the images taken